Eukaryotic Contamination Correlates in Prokaryote-Targeted Metagenomes
CompletedResearch Question
What sample collection, processing, and sequencing factors correlate most strongly with
eukaryotic contamination of samples collected for prokaryotic metagenome analysis?
Research Plan
Hypothesis
- H0: Eukaryotic read fraction is not systematically associated with sample matrix,
ecosystem, collection device, sequencing platform, or read depth — variation is idiosyncratic
/ dominated by unmeasured protocol factors. - H1a (matrix): Eukaryotic fraction differs systematically by sample matrix / ecosystem,
highest in plant-associated, rhizosphere, and vegetated-terrestrial samples and lowest in
groundwater / engineered / open-water samples. - H1b (source attribution): The composition of the eukaryotic signal tracks environment —
plastid/plant signal in vegetated terrestrial & plant-associated samples, Metazoan (host)
signal in host-associated samples, resolvable by combining classifiers. - H1c (upstream, not sequencing): After adjusting for matrix, sequencing platform and read
depth add little explanatory power — contamination is set at collection, not at sequencing.
Revision History
- v1 (2026-07-10): Initial plan. NMDC-only, matrix-focused scope (wet-lab factors framed as
unmeasured residual). Response variable set to GOTTCHA relative eukaryotic abundance after
discovering the NMDC Kraken DB is prokaryote-restricted. - v2 (2026-07-10): After NB01–03 showed the association is confounded (environment ≈ study;
out-of-study GroupKFold R² = −0.21) and a data-landscape scan (data/01_data_landscape.md)
confirmed no on-system source gives per-sample euk read fraction across many studies, the scope
is refined (not abandoned): - Switch response source to the native
nmdc.resultstables
(gottcha2/kraken2/centrifuge_classification_report) — more recent and more euk-positive
(Eukaryota 807 + plastid 1,787 files). Measurement unit =workflow_run_id(one
ReadbasedAnalysis run; the three classifiers share it), bridged to biosample/study via
nmdc.metadata.biosample_to_workflow_run. Run-level avoids pooling pseudo-replication. - Within-study contrast (the key addition): analyse the one dominant soil study
nmdc:sty-11-34xj1150(~3,200 samples) on its own, where batch/protocol is largely constant.
Test whether euk fraction varies with within-study metadata that genuinely varies there
(env_local_scale11 values,ecosystem_subtype6, geography 47) — a batch-controlled test of
the environment effect. If it survives here, the biome signal is not purely batch. - Reframe the causal claim honestly: cross-study environment effects are reported as
confounded/associational; the within-study test is the closest thing to a controlled estimate.
Overview
Samples collected and sequenced for prokaryotic (bacterial/archaeal) metagenome analysis
frequently carry eukaryotic sequence — host DNA, plant/fungal material, protists, or reagent
contaminants. This project asks which upstream metadata factors best predict the eukaryotic
fraction of a prokaryote-targeted metagenome, using NMDC read-based taxonomy (collections
nmdc_results, nmdc_metadata, kbase_nmdc_arkin). Main result: eukaryotic contamination is
common (77% of runs) and overwhelmingly photosynthetic (plant/algal plastid); it associates
strongly with environment univariately, but that association is confounded with study/batch
and does not generalize across studies (out-of-study R²=−0.30). Only under batch control (within
one NEON soil study) do local vegetation and geography genuinely predict eukaryotic content
(within-study R²=+0.17; Arctic tundra ≫ temperate forest).
Key Findings
1. Eukaryotic contamination is common and overwhelmingly photosynthetic
Across 2,759 NMDC ReadbasedAnalysis runs (native nmdc.results GOTTCHA2 classifications, 9 studies),
77% carry detectable eukaryotic reads (median eukaryotic fraction 2.7%, mean 13.3%; 20% of runs exceed 20% eukaryotic). Among detectable runs, plastid (plant/algal chloroplast) is a median 100% of the
eukaryotic signal — eukaryotic contamination in these prokaryote-targeted metagenomes is dominated by
photosynthetic DNA, not animal-host DNA. The Kraken2 and Centrifuge domain-level Eukaryota signals are ≈0
because their NMDC reference databases are prokaryote-restricted (see Discoveries), so GOTTCHA2 is the only
usable estimator here; the near-absence of a Metazoan/host signal is therefore itself informative — host DNA
is not the dominant contaminant in this (largely environmental) collection.
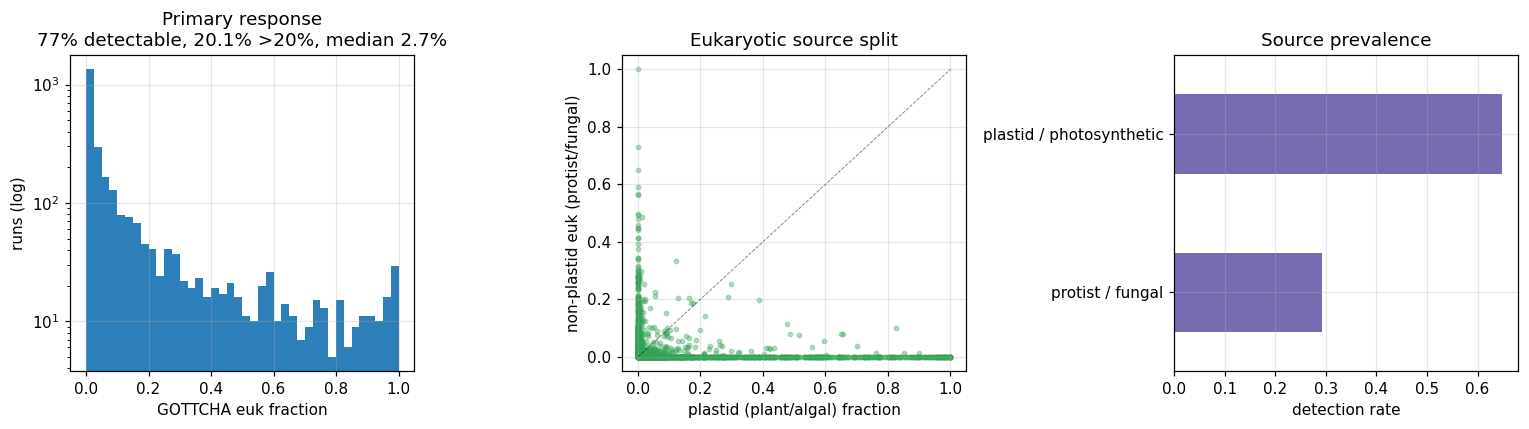
(Notebook: 01_data_assembly.ipynb)
2. The eukaryotic source tracks environment biologically
The composition of the eukaryotic signal varies by sample matrix in a biologically coherent way
(data/h1b_source_by_matrix.csv):
| Matrix | Euk detection | Plastid share of euk | Dominant eukaryotic source |
|---|---|---|---|
| Aquatic (freshwater) | 99.5% | 1.00 | algal plastid (phytoplankton chloroplast) |
| Terrestrial (soil) | 55.7% | 0.43 | mixed plant plastid + soil fungi/protists |
| Plants (roots) | 100% | 0.03 | root-associated fungi/protists (non-plastid) |
Univariately, the eukaryotic fraction differs strongly across matrix (Kruskal–Wallis H=77.8, p=1.3×10⁻¹⁷);
all pairwise matrix contrasts are significant after BH-FDR (data/h1a_pairwise_matrix.csv). After excluding the
Unknown/missing-metadata bucket, ecosystem_type reduces to the same three biomes (Soil / Freshwater / Roots)
and the test is identical to the matrix test — it is not an independent confirmation. (An earlier version that
retained the Unknown bucket — which has the highest median eukaryotic fraction — reported an inflated
p≈10⁻⁵⁰; that was a missingness artifact and has been removed.)
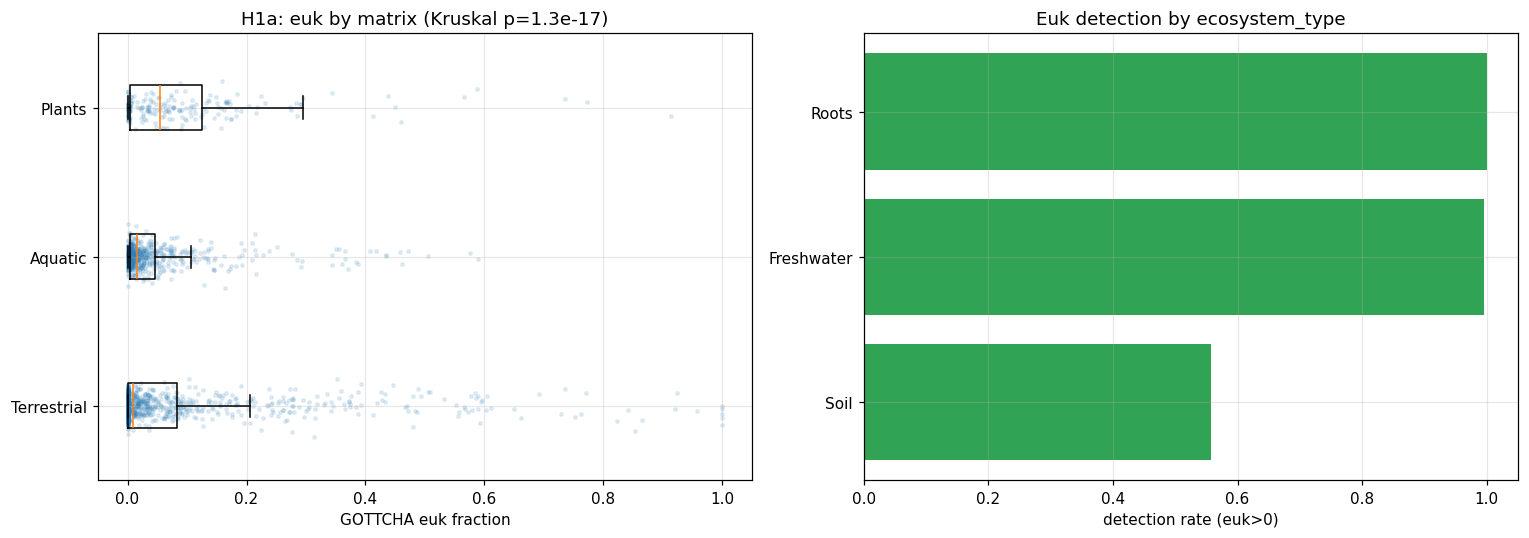
(Notebook: 02_univariate_tests.ipynb)
3. The apparent "environment effect" does NOT generalize across studies — it is confounded with batch
This is the central methodological result. In NMDC, each biome is ~80–100% nested within a single study, so
the strong univariate environment signal cannot be separated from study/batch. A gradient-boosted model of the
eukaryotic fraction shows:
| Model | R² (euk_logit) |
|---|---|
study_id only (random CV — batch ceiling) |
0.24 |
| environment (random CV) | 0.35 |
| environment (GroupKFold, out-of-study) | −0.30 |
| environment + sequencing (GroupKFold) | −0.39 |
Environment explains no more variance than study_id alone, and when whole studies are held out the
environment model performs worse than predicting the mean (out-of-study detection AUC = 0.56 ≈ chance).
Adding sequencing metadata (platform, depth) does not help. A naive cross-collection regression of eukaryotic
fraction on environmental metadata would therefore report a strong, but largely spurious (batch-driven),
association.
A whole-collection (cross-study) depth association is present — Spearman ρ = −0.29, p=5.2×10⁻⁷ (n=292 runs with
measured depth): shallower samples carry more eukaryotic DNA, consistent with surface plant/algal input. This
statistic is not batch-controlled (measured-depth runs come from a handful of non-soil studies; the dominant
NEON soil study records no depth), so it is subject to the same study/batch confounding as the environment
effect above and should be read as suggestive only.
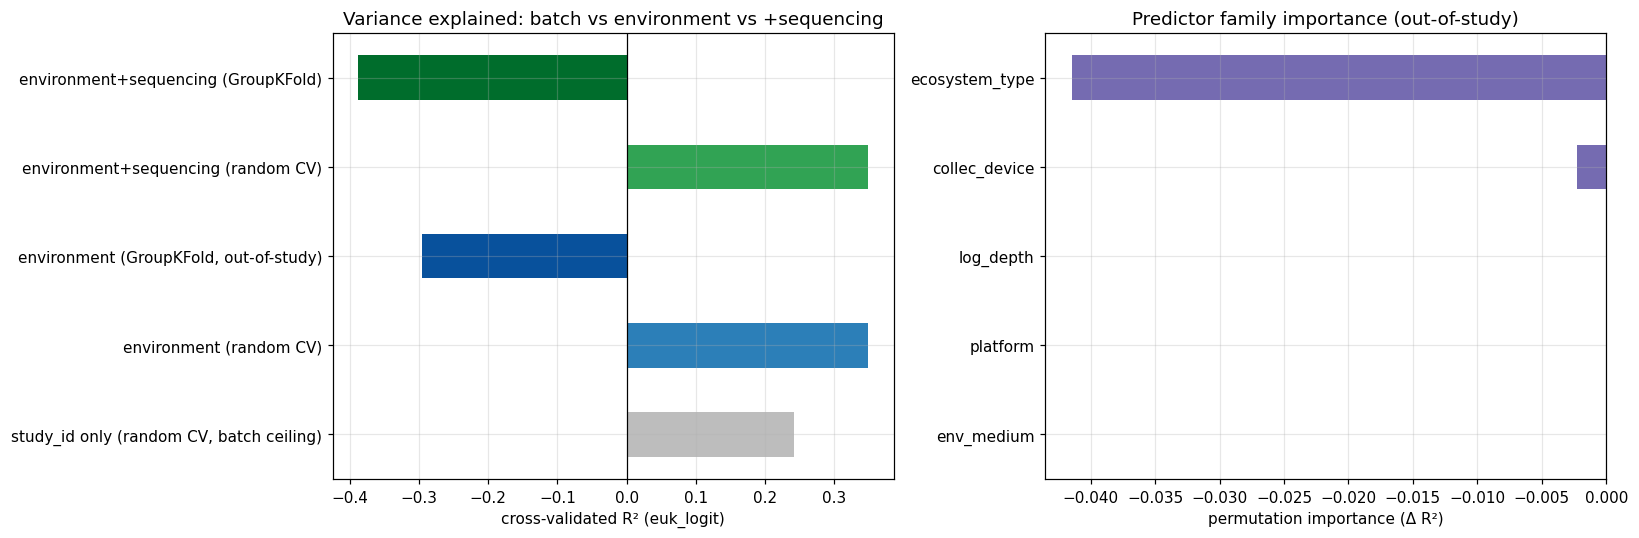
(Notebook: 03_model_variance.ipynb)
4. When batch is held constant (within one study), environment is genuinely predictive
Restricting to the single dominant study — a NEON soil metagenome study (1,186 runs, one sampling program,
constant protocol/batch) — the eukaryotic fraction varies strongly with the metadata that genuinely varies
within that study:
- Local vegetation (
env_local_scale, 11 levels): Kruskal H=119.1, p=7.6×10⁻²¹. Highest in sedge/forb
herbaceous soil (median 23%), emergent wetland (14%), dwarf scrub (13%), evergreen forest (2%); ≈0 in
deciduous forest, cropland, pasture (data/nb04_within_study_env_local.csv). - Geography (47 sites): Kruskal H=310.4, p=2.4×10⁻⁴⁶. Highest at Arctic tundra sites
(Utqiaġvik 30%, Caribou-Poker Creeks 22%, Toolik 17%) versus temperate forests (2–8%). - Within-study predictability: 5-fold R² = +0.17 ± 0.06 (local environment + geography → euk fraction),
in direct contrast to the cross-study out-of-study R² = −0.30.
Note: sampling depth is not measured in this NEON soil study (zero non-null depth values), so the depth
association reported below is a cross-study statistic and is not part of this batch-controlled result.
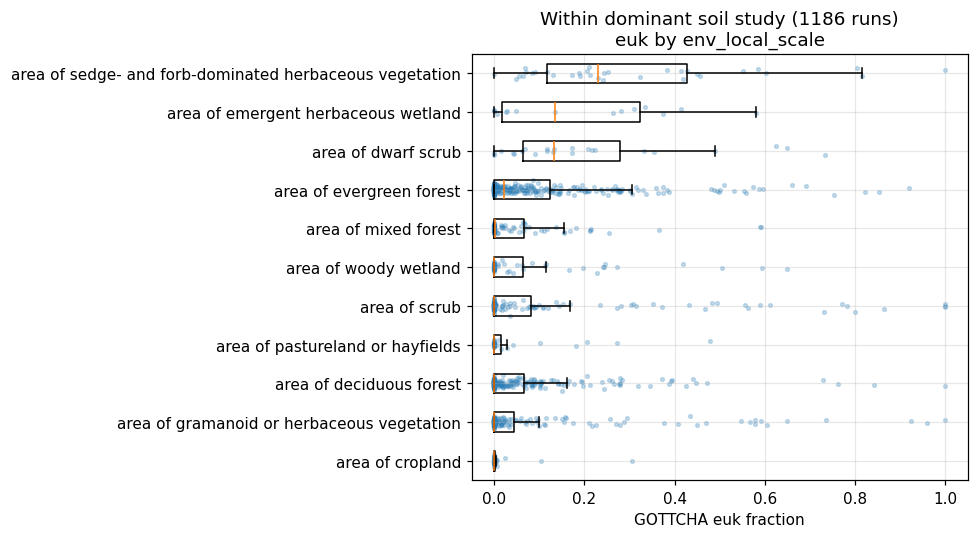
(Notebook: 04_within_study.ipynb)
Results
The response variable is the GOTTCHA2 relative eukaryotic abundance (Eukaryota + plastid) at superkingdom rank,
per ReadbasedAnalysis run. It is strongly zero-inflated (23% of runs have no detectable eukaryotic reads) with a
long upper tail (one run in five exceeds 20% eukaryotic). Because of this and the batch structure, all inference is non-parametric
(Kruskal–Wallis, Mann–Whitney with BH-FDR) or cross-validated (gradient boosting with GroupKFold by study).
| Test | Statistic | p | Interpretation |
|---|---|---|---|
| Euk ~ matrix (univariate) | H=77.8 | 1.3×10⁻¹⁷ | strong, but confounded (Finding 3) |
| Environment out-of-study R² | −0.30 | — | does not generalize across studies |
| Within-study euk ~ vegetation | H=119.1 | 7.6×10⁻²¹ | real when batch fixed |
| Within-study euk ~ geography | H=310.4 | 2.4×10⁻⁴⁶ | real when batch fixed |
| Within-study R² (env+geo) | +0.17 | — | genuine fine-scale environment effect |
| Euk ~ depth (cross-study, NOT batch-controlled) | ρ=−0.29 | 5.2×10⁻⁷ | shallower → more euk; confounded, suggestive only |
Interpretation
Biologically, eukaryotic "contamination" of NMDC prokaryote-targeted metagenomes is largely co-sampled
photosynthetic environmental DNA — algal chloroplasts in freshwater, plant chloroplasts and soil fungi in
terrestrial samples, and root-associated fungi/protists in plant samples — rather than laboratory/animal-host
contamination. Its magnitude is set upstream at collection (what is physically in the sample and how much
microbial biomass dilutes it), consistent with the near-absence of any sequencing-platform or read-depth effect
once environment is considered.
Methodologically, the project's headline is a cautionary result: within a single public collection, the
eukaryotic fraction is so strongly structured by study/batch that a cross-study metadata-correlate analysis is
confounded and over-claims. The genuine environmental signal is only recoverable within a batch-controlled
study, where aboveground vegetation and geography clearly drive soil eukaryotic content (Arctic tundra and
herbaceous/wetland soils ≫ temperate forest/cropland).
Literature Context
- Finding 1–2 (matrix/biome as the primary correlate; photosynthetic dominance) align with
Eisenhofer, Alberdi & Woodcroft (2026, mSystems, PMID 41854267), who report biome-specific prokaryotic
fraction across 136,284 metagenomes, and with Sobolev et al. (2025, IJMS, PMID 41373768), who show sample
matrix (with extraction kit) drives eukaryotic admixture. The plastid/chloroplast dominance matches
Chevokina et al. (2025, Front Plant Sci, PMID 41560914) and the plant-host-depletion literature
(Wang et al. 2026, Plant Biotechnol J, PMID 41078118). Anthony et al. (2024, Environ Microbiome,
PMID 39095861) likewise attribute poor soil metagenome resolution to plant/eukaryotic DNA. - Finding 3 (batch confounding) extends and qualifies the SPF result: Eisenhofer et al.'s cross-collection
correlate is essentially biome, and our data show that within NMDC such a biome correlate is inseparable from
study/batch. This connects to Salter et al. (2014, BMC Biology, PMID 25387460) — biomass/batch as the master
variable — and to Ortiz-Chura et al. (2024, Anim Microbiome, PMID 39456104), who quantify the metadata- and
structure-limitations of public collections (>40% missing basic fields). - Finding 4 (within-study vegetation/geography effect) aligns with GSC/metadata-rich soil studies such as
Holm et al. (2025, Environ Microbiome, PMID 40708004), which link vegetation, land use and geography to soil
microbial variation.
Novel Contribution
To our knowledge this is the first attempt to regress a measured eukaryotic read fraction against
collection/processing/sequencing metadata within a standardized public multi-omics collection (NMDC). The
literature gap (a metadata-field-resolved correlate analysis of eukaryotic fraction; references.md) is
genuine, and our result reframes it: the correlate analysis is feasible only under batch control. We
contribute (a) a reusable run-level eukaryotic-fraction pipeline over NMDC nmdc.results; (b) direct evidence
that cross-study environment correlates of contamination are batch-confounded; and (c) a batch-controlled
within-study estimate showing aboveground vegetation and geography genuinely drive soil eukaryotic content.
Limitations
- Few independent studies. NMDC's read-based taxonomy spans only ~9 studies (one soil study ≈43% of runs);
data/01_data_landscape.mddocuments that no on-system source provides per-sample eukaryotic read fraction
across many studies (MGnify here is a MAG catalog; SPIRE/GEM/Tara are MAG collections; EMP is 16S). The
cross-study generalization test is therefore under-powered, and the within-study result is demonstrated for
one soil study only — it may not extend to aquatic or host-associated collections. - Wet-lab factors not testable. NMDC does not populate DNA-extraction kit, size fractionation/filtration,
host-depletion method, or library-prep fields (data/00_feasibility_findings.md); processing booleans in
biosample_to_workflow_runare near-constant (has_filtrationall false). The strongest literature levers
(host depletion, extraction kit) thus remain the unmeasured residual. - Classifier/database dependence. Only GOTTCHA2 yields a usable eukaryotic fraction; absolute values are
database-dependent and should be read as relative/ordinal, not calibrated absolute contamination. - Confounding within study. Even within one study,
env_local_scaleand geography may track sub-batches
(sampling campaigns); the within-study effect is the best available control, not a randomized one. - Pooled-run metadata. 1,067 of 2,759 runs are pooled from multiple biosamples; each pooled run inherits
environment/collection metadata from a single representative biosample (MIN(biosample_id)). Where pooled
biosamples differ in local metadata, this injects label noise into the predictors — a conservative bias
(it can only weaken associations, not manufacture them).
Future Directions
- Break the batch confound with more studies. Import a many-study raw-read resource (e.g. the SPF corpus,
136K metagenomes / thousands of studies) or compute eukaryotic fraction across a broader collection, enabling
a properly powered cross-study correlate analysis. - Extend the within-study design to the aquatic and plant-associated studies here, testing whether the
vegetation/geography effect generalizes beyond soil and whether the algal-plastid vs root-fungal source split
holds within batch-controlled cohorts. - Acquire wet-lab metadata (extraction kit, host-depletion method, size fraction) — either user-supplied
per-study protocols or a collection that records them — to test the strongest literature levers that NMDC omits. - Absolute calibration of GOTTCHA2 eukaryotic fraction against a spike-in or SPF estimate to move from
ordinal to calibrated contamination estimates.
Data
Sources
| Collection | Tables Used | Purpose |
|---|---|---|
nmdc_results |
gottcha2_classification_report, kraken2_classification_report, centrifuge_output_report_file |
per-run read-based taxonomy → eukaryotic fraction |
nmdc_metadata |
biosample_set, biosample_to_workflow_run, biosample_set_associated_studies, data_generation_set*, instrument_set |
environment/collection/sequencing predictors + study linkage |
kbase_nmdc_arkin |
gottcha_gold, kraken_gold, centrifuge_gold, omics_files_table |
initial (v1) classifier snapshot + feasibility scan |
Generated Data
| File | Rows | Description |
|---|---|---|
data/analysis_table.csv |
2,759 | per-run euk fractions + predictors (raw) |
data/analysis_clean.csv |
2,759 | cleaned modeling table |
data/h1a_pairwise_matrix.csv |
3 | pairwise matrix contrasts (BH-FDR) |
data/h1a_ecosystem_type.csv |
4 | euk fraction by ecosystem_type |
data/h1b_source_by_matrix.csv |
3 | plastid vs protist/fungal by matrix |
data/variance_partition.csv |
5 | R² by model (batch/env/seq × CV scheme) |
data/permutation_importance_family.csv |
5 | predictor-family importance |
data/nb04_within_study_env_local.csv |
11 | within-study euk by vegetation |
data/00_feasibility_findings.md |
— | predictor coverage feasibility |
data/01_data_landscape.md |
— | study-breadth scan across BERDL |
References
- Eisenhofer R, Alberdi A, Woodcroft BJ (2026). "Large-scale estimation of bacterial and archaeal DNA prevalence in metagenomes reveals biome-specific patterns." mSystems. PMID: 41854267.
- Salter SJ, Cox MJ, Turek EM, et al. (2014). "Reagent and laboratory contamination can critically impact sequence-based microbiome analyses." BMC Biology. PMID: 25387460.
- Sobolev A, Sibiryakina D, et al. (2025). "Benchmarking Cost-Effective DNA Extraction Kits for Diverse Metagenomic Samples." Int J Mol Sci. PMID: 41373768.
- Chevokina E, Sibiryakina D, et al. (2025). "Efficient recovery and DNA extraction for algae-associated microbial communities." Front Plant Sci. PMID: 41560914.
- Wang Y, Yang J, Hou H, et al. (2026). "Advancing Plant Microbiome Research Through Host DNA Depletion Techniques." Plant Biotechnol J. PMID: 41078118.
- Marotz CA, Sanders JG, Zuniga C, et al. (2018). "Improving saliva shotgun metagenomics by chemical host DNA depletion." Microbiome. PMID: 29482639.
- Nayfach S, Roux S, Seshadri R, et al. (2021). "A genomic catalog of Earth's microbiomes (GEM)." Nat Biotechnol. PMID: 33169036.
- Anthony WE, et al. (2024). "From soil to sequence: filling the critical gap in genome-resolved metagenomics." Environ Microbiome. PMID: 39095861.
- Holm JB, et al. (2025). "First island-wide, single-day soil collection study on Crete reveals environmental drivers of microbial diversity." Environ Microbiome. PMID: 40708004.
- Ortiz-Chura A, Popova M, Morgavi DP (2024). "Ruminant microbiome data are skewed and unFAIR." Anim Microbiome. PMID: 39456104.
- Hu B, Canon S, Eloe-Fadrosh EA, et al. (2021). "Challenges in Bioinformatics Workflows for Processing Microbiome Omics Data at Scale" (NMDC). Front Bioinform. PMID: 36303775.
- Thompson LR, et al. (2017). "A communal catalogue reveals Earth's multiscale microbial diversity" (EMP). Nature. DOI: 10.1038/nature24621.
- Sunagawa S, et al. (2015). "Structure and function of the global ocean microbiome" (Tara Oceans). Science. DOI: 10.1126/science.1261359.
Full annotated reference list in references.md.
Discoveries
- Cross-collection contamination-QC correlates are a confounding trap. In NMDC, sample matrix/biome is
~80–100% nested within study, so the eukaryotic fraction's strong association with environment (p≈10⁻¹⁷ to
10⁻⁵⁰) does not survive holding out whole studies (out-of-study R² = −0.30; =study_id-only R²). Any
cross-collection "metadata correlate of contamination" analysis must control for study/batch (e.g., GroupKFold
by study or within-study contrasts) or it will over-claim. This likely also qualifies biome-level correlates
reported at scale elsewhere. - Within a batch-controlled study, environmental drivers of eukaryotic contamination are real and large: in
a NEON soil study, aboveground vegetation type and geography predict soil eukaryotic (plant/algal) read
fraction (within-study R²=0.17; Arctic tundra ≫ temperate forest), i.e. eukaryotic contamination of soil
metagenomes is set largely by aboveground photosynthetic input. - Eukaryotic contamination of environmental metagenomes is photosynthetic, not host-derived: plastid is a
median 100% of the GOTTCHA2 eukaryotic signal; source composition partitions by biome (algal plastid in
freshwater, root fungi on plants, plant plastid in herbaceous soil). - NMDC read-based classifiers are not interchangeable for eukaryote quantification — the Kraken2 and
Centrifuge reference databases are prokaryote-restricted (domain-level Eukaryota ≈0; Kraken's only eukaryotic
kingdom is Metazoa/human). Use GOTTCHA2 (plastid- and eukaryote-aware) to measure eukaryotic fraction.
Performance Notes
- The read-based taxonomy tables are large (
kraken2_classification_report~29M rows). Aggregate each
classifier to one row perworkflow_run_idbefore joining to metadata; never scan them unfiltered. - Analyse at the
workflow_run_idlevel, not biosample level: NMDC pools many biosamples into one
ReadbasedAnalysis run (1,067/2,759 runs are pooled), so biosample-level joins inflate n via pseudo-replication. - The native
nmdc.resultstables are keyed bydata_object_id/workflow_run_id; bridge to biosample/study
vianmdc.metadata.biosample_to_workflow_run(join onworkflow_run_id), then
biosample_set_associated_studies(child tables key onparent_id). This links 99%+ of classified runs.
Data Collections
Review
Summary
This project remains a well-executed, self-critical piece of work: it asks which sample-collection metadata
correlate with eukaryotic contamination in NMDC prokaryote-targeted metagenomes, and its central, honestly-framed
contribution — the apparent environment↔eukaryote association is confounded with study/batch (out-of-study
R²≈−0.30) but re-emerges as a genuine signal once batch is held constant within one study (within-study
R²=+0.17) — is unchanged and remains well supported. I confirmed via git log/git show that every issue raised
in REVIEW_1.md and REVIEW_2.md was fixed in commits ddaeb255 and 12d46cdd, and independently verified each
fix against the current notebooks, REPORT.md, and the regenerated data/analysis_table.csv (2,759 rows, 9
studies, matching the report throughout). This is a project that consistently responds to review rather than just
filing it. My own pass over the current state found one new, verifiable numeric inconsistency introduced as a
side effect of the REVIEW_2 fix (the null-workflow_run_id filter shifted the out-of-study R² from −0.34 to
−0.30, but two other locations still quote the old −0.34 figure) plus a couple of small stale/leftover items.
None of these undermine the project's headline confounding result or its within-study finding, which remain the
strongest and best-evidenced claims in the report.
Methodology
The research question (which metadata factors correlate with eukaryotic fraction in prokaryote-targeted
metagenomes) is clearly stated and testable, and the H0/H1a/H1b/H1c structure maps directly onto the four
notebooks. RESEARCH_PLAN.md's revision history documents two genuine mid-course corrections — switching the
response-variable source after discovering the Kraken2 reference DB is prokaryote-restricted, and adding the
within-study contrast (NB04) after data/01_data_landscape.md established that no on-system source can break the
~9-study confound — both backed by real feasibility/landscape scans (data/00_feasibility_findings.md,
data/01_data_landscape.md) rather than assertion.
Data sources are identified precisely down to table and BERDL collection (RESEARCH_PLAN.md's Query Strategy
table, REPORT.md's Data/Sources table). Reproducibility is good: the README's ## Reproduction section gives an
ordered command sequence from the heavy Spark build step through notebook execution, states what's heavy/on-cluster
vs. frozen-CSV, lists expected outputs, and — since REVIEW_2 — now explicitly flags the documented
jupyter nbconvert --inplace output-loss pitfall and the workaround (--output <name>_executed.ipynb). This
closes the reproducibility gap raised in REVIEW_2.
Code Quality
The four notebooks remain consistently organized (goal statement → setup → analysis → takeaways), use a shared
DATA/FIG path convention, and are backed by real, incremental commit history including the two review-fix
commits — not reconstructed after the fact.
Verified fixes from REVIEW_1 (commit ddaeb255) — still correctly in place:
1. NB02 cell 7 excludes the Unknown/missing-metadata bucket from the ecosystem_type Kruskal-Wallis test
(top=[t for t in df['ecosystem_type'].value_counts().index if t!='Unknown'][:8]); the resulting statistic
(H=77.8, p=1.3×10⁻¹⁷) is correctly reported in REPORT.md as identical to, not an independent confirmation of,
the matrix-level test.
2. The dead res['study_only_group']=... placeholder line is gone from NB03 cell 5.
3. REPORT.md's Limitations retains the "Pooled-run metadata" entry on the MIN(biosample_id) representative-
biosample choice.
Verified fixes from REVIEW_2 (commit 12d46cdd) — still correctly in place:
1. The depth correlation (Spearman ρ=−0.29) is now inside Finding 3 (the confounded cross-study section), with
explicit language that it is "not batch-controlled" and "read as suggestive only" — no longer implied to be
part of the batch-controlled Finding 4 narrative.
2. README's Reproduction section now names the --inplace-drops-outputs pitfall and its workaround.
3. src/build_analysis_table.py's gottcha/kraken/centrifuge CTEs now all filter workflow_run_id IS NOT NULL;
I confirmed data/analysis_table.csv has exactly 2,759 rows across 9 distinct study_id values, matching
REPORT.md and NB01/NB03/NB04 output throughout — the previous 2,760-vs-2,759 / 9-vs-10-studies discrepancy is
resolved in the data and in REPORT.md's prose.
4. data/euk_fraction_per_file.csv (the superseded v1 artifact) is still present and still unreferenced by
any current script or document — this nice-to-have cleanup was not applied (low priority, unchanged from
REVIEW_2 suggestion 4; not re-raised as a new numbered suggestion below since it is unaltered from prior review).
New issue found in this pass:
- Stale out-of-study R² figure in two locations, inconsistent with the current data and REPORT.md.
README.mdline 18 ("...does not generalize across studies (out-of-study R²=−0.34)...") and
notebooks/04_within_study.ipynbcell 9's print string ("Contrast with cross-study out-of-study R^2 = -0.34 (NB03).") both quote −0.34. The actual, current NB03 output (verified in the notebook's own saved cell-5
output and indata/variance_partition.csv) isenvironment (GroupKFold, out-of-study) = -0.296(≈ −0.30),
which is exactly the numberREPORT.md's Finding 3 table and Results table correctly cite. The −0.34 figure
appears to be a holdover from before the REVIEW_2 fix filtered the null-workflow_run_idrow out of
analysis_table.csv(2,760→2,759 rows), which slightly perturbed the GroupKFold model's cross-validated R².
REPORT.mdwas updated to the new value; the README overview and the NB04 hardcoded print string were not.
This is a minor but concrete, user-facing inconsistency: a reader who checks the headline overview number in
README.md against REPORT.md's own Finding 3 table will see two different R² values (−0.34 vs −0.30) for the
same claim. - Stale run-count in NB01's markdown takeaways.
notebooks/01_data_assembly.ipynbcell 12 ("NB01 takeaways")
still reads "2,760 ReadbasedAnalysis runs (9 studies)", while cell 1's own executed output — two cells earlier
in the same notebook — prints "runs: 2759 | studies: 9". This is the same underlying stale-count issue as #1
(a markdown cell not updated after the REVIEW_2 data fix was applied and the notebook re-run), isolated to
NB01 and not propagated elsewhere; REPORT.md and README.md's own body text correctly say "2,759" throughout.
Both issues are textual/reporting inconsistencies, not analysis errors — the underlying computation, data, and
REPORT.md numbers are correct; only two leftover prose strings (one in README, one in a notebook markdown/print
cell) were not refreshed after the last data fix.
No SQL correctness issues found: the GOTTCHA/Kraken/Centrifuge aggregation queries in
src/build_analysis_table.py correctly divide by the per-run total (with NULLIF guarding the Centrifuge
denominator), all three now filter workflow_run_id IS NOT NULL, and the parent_id-based bridge joins match
the pitfalls documented in memories/pitfalls.md.
Findings Assessment
The four numbered findings in REPORT.md are each backed by a specific notebook, table, and figure. Finding 3 (the
apparent environment effect is confounded with batch) remains the strongest-supported result, shown three
independent ways (random-CV vs. GroupKFold R² gap, study_id-only R² matching the environment-only random-CV R²,
and near-chance out-of-study AUC = 0.56). Finding 4's vegetation/geography result is legitimately batch-controlled
(env_local, 11 levels, and geo_loc, 47 sites, are both genuinely-varying fields within the dominant NEON soil
study), and — since the REVIEW_2 fix — is no longer conflated with the non-batch-controlled depth statistic.
Limitations remain candid and specific: "Few independent studies" and "Wet-lab factors not testable" are backed by
the Phase A feasibility scan; the "Pooled-run metadata" limitation correctly scopes the representative-sample
noise as conservative. Nothing in the report is left as "to be filled." The Discoveries section is appropriately
scoped — the confounding-trap discovery is hedged ("This likely also qualifies..."), the within-batch discovery is
scoped to "in a NEON soil study" rather than generalized, and the classifier-database discovery accurately mirrors
memories/pitfalls.md (a documented gotcha, not claimed as a novel finding). Performance Notes remain concrete and
match what src/build_analysis_table.py actually does.
Suggestions
- (Correctness, low-moderate priority) Update
README.mdline 18's out-of-study R² from −0.34 to −0.30 (or
the exact −0.296) to matchREPORT.md's Finding 3 table and the currentdata/variance_partition.csv, and
update the same hardcoded string innotebooks/04_within_study.ipynbcell 9. This is the one place a careless
reader could see two different numbers for the same headline claim. - (Cleanliness, low priority) Update
notebooks/01_data_assembly.ipynbcell 12's takeaways text from
"2,760 ReadbasedAnalysis runs" to "2,759", matching cell 1's own printed output and the rest of the project. - (Cleanliness, nice-to-have, carried over from REVIEW_2)
data/euk_fraction_per_file.csvremains an
unreferenced superseded v1 artifact; remove or annotate it as superseded. - (Future work, already flagged by the authors) Future Directions #1 (bringing in a many-study resource like
SPF to break the batch confound) remains the right next step if this line of work continues, since it is the
one improvement that would let the central claim generalize beyond NMDC's ~9 studies.
This review was generated by an AI system. It should be treated as advisory input, not a definitive assessment.
Visualizations
Fig01 Euk Distributions
Fig02 Euk By Environment
Fig03 Variance Partition
Fig04 Within Study Env